This week we saw the publication of more data related to religion and society from Census 2021. And it makes interesting reading.
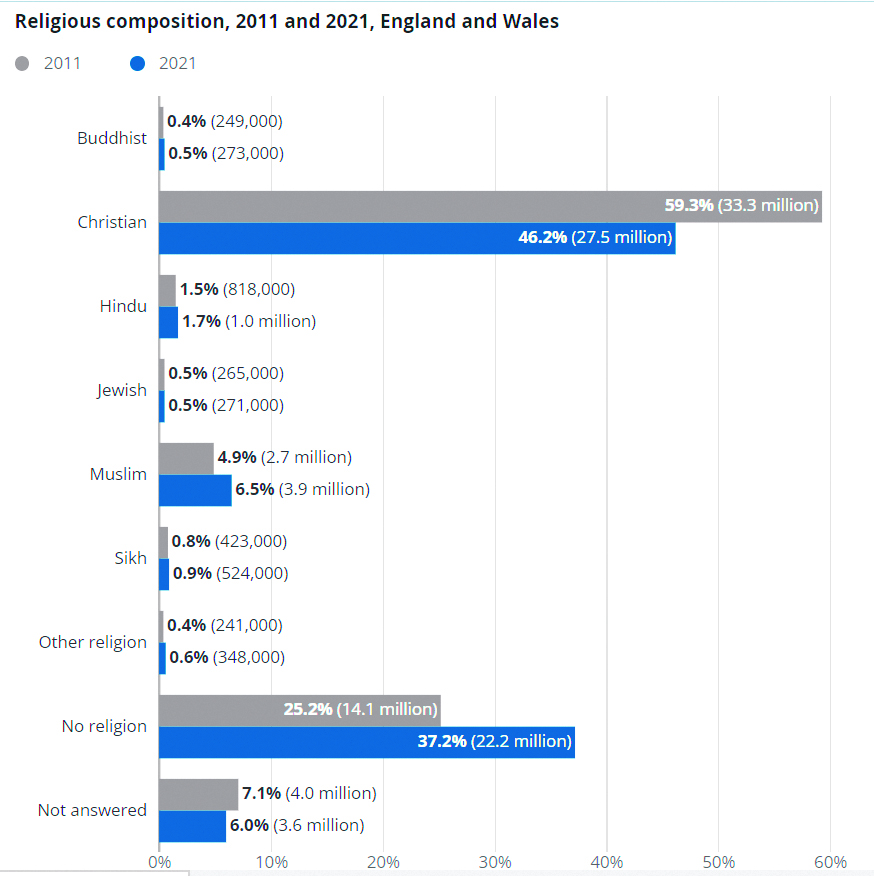
For the first time, one can describeEngland and Wales as not wholly Christian. Less than half of the population (46.2%, 27.5 millionpeople) described themselves as “Christian”,this is a massive decrease of 13.1 percentage point from 59.3% (33.3 million) in2011.
It seems people are getting fed up with religion. “No religion” was the second most common response, this saw a rise of 12.0 percentage points to 37.2% from 25.2% in 2011. A thought does come to mind, ‘are Christian denouncing their faith’?
So what about other faiths? Interestingly, there were increases in the number of people who described themselves as “Muslim” (3.9 million, 6.5% in2021, up from 2.7 million, 4.9% in 2011) and “Hindu” (1.0 million, 1.7% in 2021, up from 818,000, 1.5% in2011). This represents a massive increase in the Muslim population.No wonder the Labour Party are working overtime in accommodating the whims and wishes of this community.
Religious composition chart:

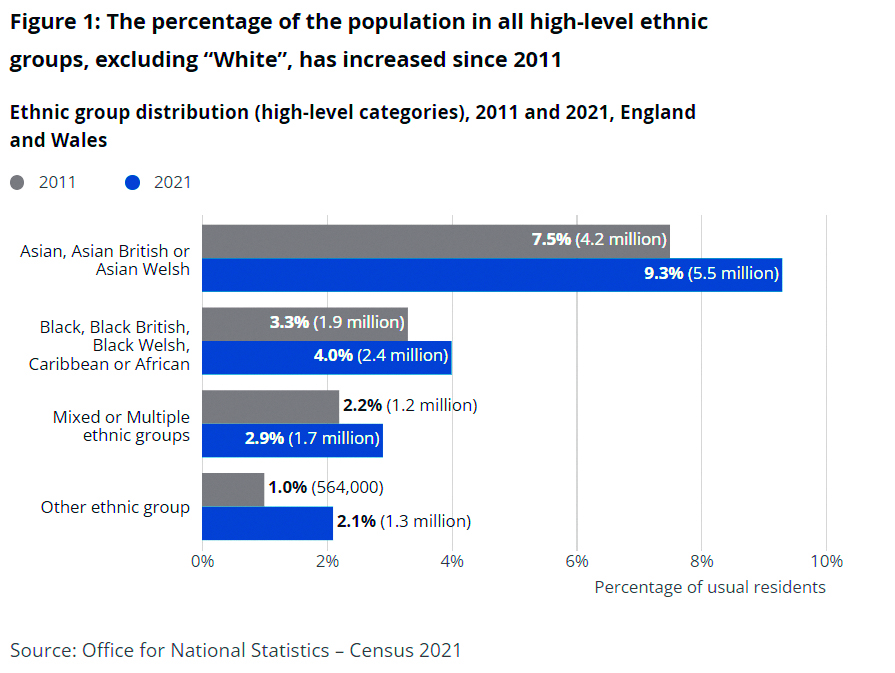
The picture becomes even more interesting when you take ethnicity into account. In 2021, 81.7% in England and Wales identified their ethnic group as"White", a decrease from 86.0% in the 2011 Census. Therefore 18.3% are non-white!
Ethnic profile chart 1:
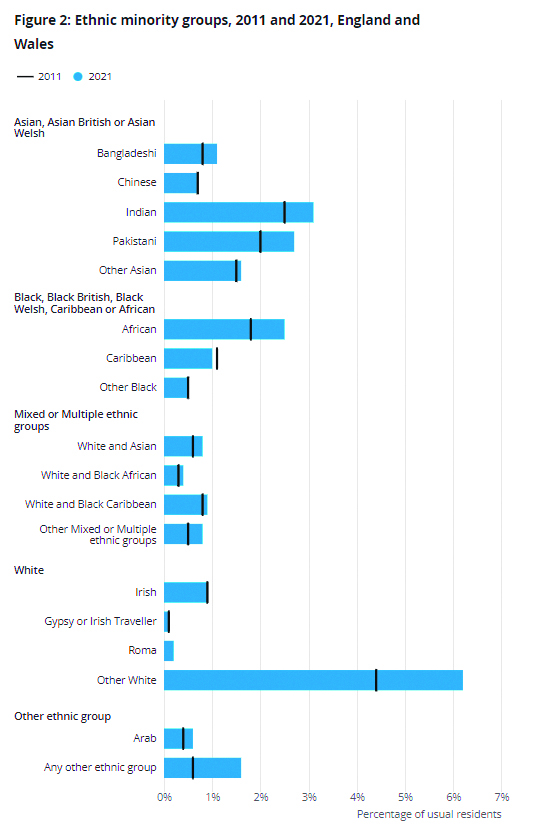
The next most common ethnic group was "Asian, Asian British or Asian Welsh" accounting for9.3% of the overall population, this group also saw the largest percentage pointincrease from 2011, up from 7.5%.Of course we all know that under the term ‘Asian’, much is hidden. The reality of what this means becomes clearer when we consider the spread within the group itself.
Ethnic profile chart 2:
The"Other ethnic group"category saw some big changes as well(1.6%, 924,000 in 2021, up from 0.6%, 333,000 in 2011), and "Black, Black British, Black Welsh, Caribbean or African: African" (2.5%, 1.5 million in 2021, up from 1.8%, 990,000).
As in 2011, the area with the highest percentage of the population who described themselves as “Muslim” was Tower Hamlets (39.9%, up from 38.0% in 2011). Other areas with high percentages of people responding as “Muslim” included Blackburn with Darwen (35.0%) and Newham (34.8%).
Harrow remained the highest percentage for“Hindu” (25.8%, up from 25.3% in 2011), but Leicester, the second highest percentage, had a greater increase of 2.7 percentage points (17.9%, up from 15.2% in 2011).
The census releases a huge amount of data. It will take some time to do some interesting analysis and this I will re-visit in due course. For the time being, I am sure the above will keep all groups busy in discussing the state of play with respect to British society and where it is heading. I wonder where we will be in 2031 if the present rate of change is maintained. I am certain of one thing, as a society we better come to terms with these seismic changes quickly to avoid a societal meltdown.
Note: Data/information courtesy ofOffice for National Statistics (ONS)Census 2021